
In the dynamic world of cryptocurrency trading, success often hinges on the ability to interpret and react to market signals. Among the most potent of these signals are chart patterns, a cornerstone of technical analysis that offers traders a visual roadmap to navigate the often turbulent crypto markets.
Embracing the Power of Chart Patterns in Crypto Trading
Chart patterns are not just random shapes on a price graph; they are the footprints of market sentiment, representing the collective actions and reactions of traders to various economic, political, and social factors. By learning to recognize and interpret these patterns, traders can gain insights into potential market movements, making informed decisions that could lead to profitable trades.
But what exactly are chart patterns? At their core, chart patterns are distinctive formations created by the fluctuations in the price of cryptocurrencies. These patterns can be broadly categorized into three types:
- Reversal Patterns: Indicating a potential change in the current trend direction.
- Continuation Patterns: Suggesting the persistence of an existing trend.
- Bilateral Patterns: Offering scenarios where the market could move in either direction.
Understanding these patterns is crucial for any trader looking to master the art of crypto trading. Each pattern tells a unique story about market sentiment, trader behavior, and potential price movements. From the classic Head and Shoulders pattern signaling a bearish reversal to the bullish implications of a Cup and Handle formation, each pattern serves as a vital clue in the complex puzzle of market analysis.
The ability to correctly identify and interpret chart patterns can be a significant advantage in the fast-paced world of crypto trading. This article aims to provide a comprehensive guide to the most critical chart patterns, offering both novice and seasoned traders the knowledge and tools to harness the full potential of these market indicators.
Stay tuned as we delve deeper into the world of crypto chart patterns, where each line, curve, and intersection can unlock the secrets to trading success.
Understanding the Basics of Chart Patterns
Before diving into the intricacies of individual chart patterns, it’s essential to grasp the fundamentals that underpin their significance in crypto trading.
1. The Language of the Market:
- Visual Storytelling: Chart patterns are a form of visual storytelling, depicting the ongoing tug-of-war between buyers and sellers. They encapsulate the emotions, expectations, and decisions of market participants, making them a critical tool for understanding market psychology.
- Historical Repetition: One of the core principles of chart analysis is that history tends to repeat itself. Patterns observed in the past often reoccur, allowing traders to anticipate potential market movements.
2. Types of Chart Patterns:
- Reversal Patterns: These indicate a possible change in the current trend. Examples include the “Head and Shoulders” and “Double Top” patterns, which often signal an impending shift from a bullish to a bearish market or vice versa.
- Continuation Patterns: Such patterns suggest that the existing trend is likely to continue. The “Bullish Flag” and “Ascending Triangle” are classic examples, hinting at the persistence of the current trend.
- Bilateral Patterns: These are unique as they offer scenarios where the market could move in either direction, making them somewhat more challenging to interpret. The “Symmetrical Triangle” is a prime example of a bilateral pattern.
3. Chart Pattern Reliability:
- Not a Guarantee: While chart patterns provide valuable insights, they are not infallible. They should be used in conjunction with other indicators and analysis methods for a more comprehensive view of the market.
- Probability Game: Trading based on chart patterns is essentially a game of probabilities. No pattern guarantees a specific outcome, but they do increase the chances of making a more informed trading decision.
4. The Importance of Volume:
- Volume Confirmation: Volume plays a crucial role in confirming chart patterns. An increase in volume during the formation of a pattern lends credibility to the anticipated price movement.
- Sign of Strength: Particularly with breakout patterns, a high volume is often seen as a sign of strength, indicating that a large number of traders are committing to the new trend.
5. Time Frames and Scalability:
- Flexibility Across Time Frames: Chart patterns can be identified across various time frames, from minutes to days or even weeks. This flexibility allows traders to adapt strategies to their individual trading styles and goals.
- Scalability: Whether a trader is looking at a short-term scalping strategy or a long-term position trading approach, chart patterns can be scaled to fit their specific timeframe and risk profile.
Key Chart Patterns Every Trader Should Know
As we explore some of the most critical chart patterns in cryptocurrency trading. Each pattern not only offers insights into potential price movements but also helps in making strategic trading decisions.
Head and Shoulders
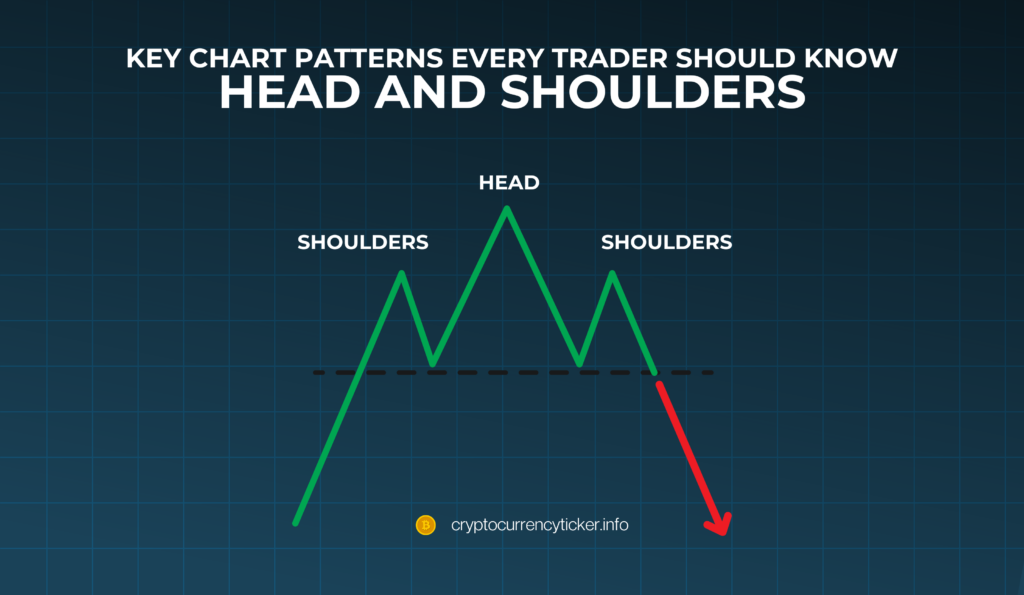
Recognized as a pivotal bearish reversal indicator, the Head and Shoulders pattern is marked by its distinctive three-peak formation. The middle peak, or the ‘head,’ is the highest, with the two side peaks, or ‘shoulders,’ being lower. This pattern typically suggests a shift from a bullish trend to a bearish one, especially when the price dips below the neckline, the line connecting the two shoulders.
Cup and Handle
Symbolizing bullish continuation, the Cup and Handle pattern mirrors the shape of a teacup. It features a rounded bottom forming the cup, followed by a slight downward drift, or the handle. This formation often indicates that an existing uptrend is expected to continue, providing a cue for potential buying opportunities.
Double Top Pattern
A crucial pattern for identifying potential bearish reversals is the Double Top Pattern. Characterized by two consecutive peaks at almost the same level, this formation suggests a change in trend from bullish to bearish. The key moment for traders is when the price falls below the support level between these peaks, signaling a selling opportunity.
Price Channels
Price Channels are formed by drawing parallel lines that connect a series of highs and lows. This pattern is invaluable for identifying areas of support and resistance. Traders often use these channels to predict potential breakout or breakdown points, buying near the lower support line and selling near the upper resistance line, or vice versa.
Ascending and Descending Triangles
These triangular patterns offer insights into potential price movements. An Ascending Triangle, with a flat upper side and a rising lower trendline, indicates bullish tendencies. Conversely, a Descending Triangle, with a flat lower side and a downward sloping upper trendline, suggests bearish potential.
Rising and Falling Wedges
Similar to triangles, Rising and Falling Wedges are significant for predicting reversals. A Rising Wedge, with both lines sloping upward, is typically a bearish signal, while a Falling Wedge, with both lines sloping downward, signals bullish tendencies.
Bullish and Bearish Flags

These patterns are short-term continuation indicators. A Bullish Flag, appearing during an uptrend, suggests the continuation of the bullish trend. In contrast, a Bearish Flag, forming during a downtrend, indicates the persistence of bearish market conditions.
Each of these patterns offers unique insights and trading opportunities in the volatile cryptocurrency market, making them essential tools for any trader’s arsenal.
How to Identify and Interpret Chart Patterns
The ability to accurately identify and interpret chart patterns is crucial for making informed trading decisions. Here’s how to approach this:
1. Pattern Recognition Techniques:
- Visual Analysis: Regularly review charts to familiarize yourself with the appearance of different patterns.
- Historical Comparisons: Compare current charts with historical patterns to understand how they have played out in the past.
- Use of Technical Tools: Incorporate tools like trend lines and volume indicators to confirm pattern formations.
2. Interpreting Chart Patterns:
- Contextual Analysis: Always consider the broader market context. A pattern doesn’t exist in isolation and can be influenced by external factors.
- Volume Confirmation: Look for volume increases to confirm the validity of a pattern, especially during breakouts.
- False Breakouts: Be cautious of false breakouts where the price action appears to confirm a pattern but reverses soon after.
3. Practical Examples:
- Head and Shoulders: A decline in volume on the second shoulder compared to the head can indicate a weakening trend and a more reliable reversal signal.
- Cup and Handle: A gentle slope of the cup and a decrease in volume at the formation of the handle can signify a strong bullish continuation.
- Ascending Triangle: Increasing volume on each successive high can confirm the strength of the bullish trend.
4. Combining Patterns with Other Indicators:
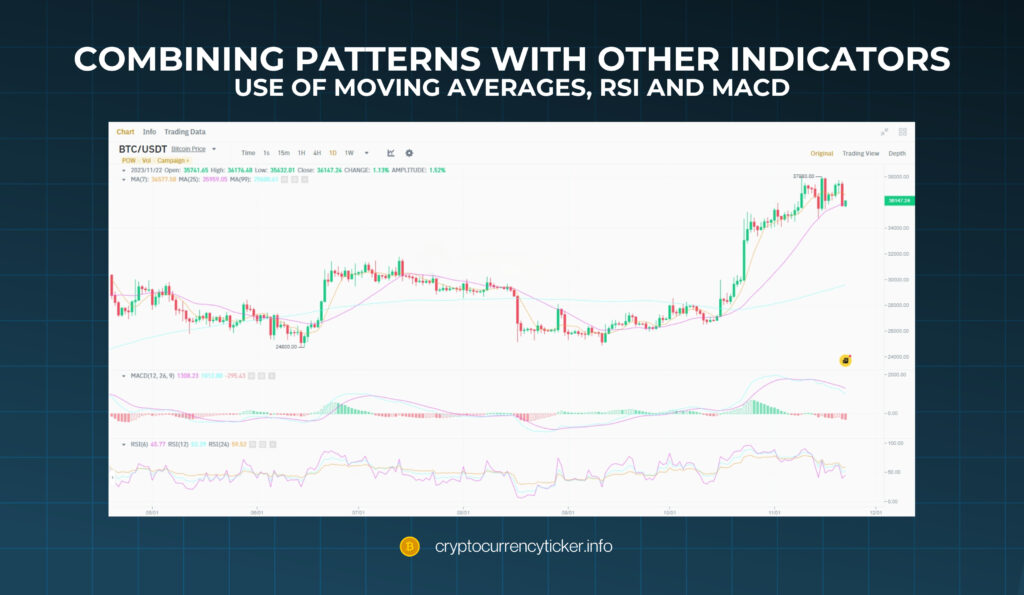
- Use of Moving Averages: Incorporate moving averages to confirm the trend direction suggested by the pattern.
- RSI and MACD: These indicators can help confirm the momentum and potential reversals signaled by chart patterns.
5. Limitations and Risks:
- No Guarantees: Patterns can fail; they are probabilities, not certainties.
- Risk Management: Always have a clear exit strategy to mitigate losses in case the pattern does not play out as expected.
Practical Tips for Trading with Chart Patterns
Trading with chart patterns requires more than just recognition skills. It involves strategic planning and execution. Here are some practical tips to enhance your trading with chart patterns:
1. Timing and Time Frames:
- Selecting the Right Time Frame: Higher time frames (like 1D or 4H) generally offer more reliable signals for beginners, while experienced traders may opt for lower time frames (1H or 15 min) for more frequent trading opportunities
- Timing Entries: Enter a trade when a pattern is freshly identified, but consider waiting for 1-2 additional candles to confirm the trend direction.
2. Entry and Exit Strategies:
- Entry Points: Look for entry points at the completion or breakout point of a pattern.
- Exit Points: Set exit points based on pattern targets or when the pattern becomes invalid (e.g., a breakout fails)
- Stop Losses: Always use stop losses to limit potential losses in case the market moves against your prediction.
3. Assessing Profit Potential:
- Target Projections: Calculate the distance between the key points of the pattern to estimate the profit potential
- Risk-to-Reward Ratio: Ensure a favorable risk-to-reward ratio to make your trading strategy sustainable in the long run.
4. Aligning with Market Trends:
- Trend Analysis: Utilize tools like the 30-period SMA (simple moving average) to determine the overall market trend and align your pattern-based trades accordingly
- Trend Confirmation: Trade buy patterns in an upward trend and sell patterns in a downward trend to increase success rates.
5. Risk Management:
- Diversify Trades: Engage in multiple small trades rather than a few large ones to distribute risk
- Leverage Management: Avoid using excessive leverage, which can amplify losses.
- Continuous Learning: Keep updating your knowledge and strategies based on market changes and personal trading experiences.
Advanced Strategies in Chart Pattern Trading
Advanced trading strategies involve not just recognizing chart patterns but also integrating them with other aspects of technical analysis for more nuanced decision-making.
- Combining with Technical Tools
Advanced traders often combine chart patterns with other technical analysis tools for a more holistic view. Integrating Bollinger Bands, Fibonacci retracement levels, and Ichimoku Clouds with chart patterns can provide a deeper understanding of market movements. Adding oscillators like the Stochastic or RSI further enhances the ability to gauge market momentum and potential reversals.
- Multiple Time Frame Analysis
Analyzing patterns across multiple time frames can reveal different facets of the market. A pattern on a daily chart might suggest a long-term trend, while the same pattern on an hourly chart offers insights into short-term movements. This approach allows for more precise entries and exits and a better understanding of the market’s overall direction.
- Behavioral Analysis
Understanding the psychology behind chart patterns can provide an edge. Analyzing why traders respond to certain patterns in predictable ways helps in anticipating market movements. Studying historical scenarios where similar patterns have emerged and their outcomes can be enlightening.
- Risk Management in Advanced Trading
With greater complexity comes higher risk. Advanced strategies often involve sophisticated risk management techniques like hedging or using derivatives. It’s crucial to balance your portfolio and avoid overexposure to a single pattern or prediction.
- Continuous Backtesting and Adaptation
Backtesting strategies against historical data is essential to assess their effectiveness. Markets evolve, and so should trading strategies. Adapting to new data and market conditions is a hallmark of a successful trader.
Incorporating these advanced strategies can significantly enhance the effectiveness of chart pattern trading in the volatile crypto market.
Conclusion: Charting Your Path to Crypto Trading Success
In this journey through the realm of crypto chart patterns, we’ve uncovered the pivotal role these patterns play in shaping trading strategies. From the basics of pattern recognition to advanced tactics, we’ve explored how these visual cues can guide traders in navigating the volatile cryptocurrency markets.
Remember, while chart patterns offer valuable insights, they are just one piece of the trading puzzle. A successful trader combines these patterns with a solid understanding of market dynamics, robust risk management, and an adaptable mindset. Continuous learning and practice remain key, as the crypto market is ever-evolving.
As you apply these insights to your trading endeavors, approach chart patterns as a tool to enhance your decision-making process, not as a standalone solution. By doing so, you’re charting a path towards more informed, strategic, and potentially profitable trading experiences in the world of cryptocurrency.