At its core, technical analysis (TA) in cryptocurrency trading is a method used by traders to evaluate and predict future market movements based on past market data, primarily focusing on price and volume. Unlike traditional markets, the crypto market operates 24/7, making the need for effective analysis tools even more crucial. Technical analysis offers traders a way to navigate this volatile and constantly evolving market by identifying patterns and trends that can hint at future price movements.
Technical vs. Fundamental Analysis
To appreciate the value of technical analysis in crypto trading, it’s essential to understand how it differs from fundamental analysis. While technical analysis deals with the “how” and “what” — how the prices are moving and what trends are emerging — fundamental analysis answers the “why.” Fundamental analysis dives deep into the intrinsic value of a cryptocurrency, considering factors like technology, team, market trends, and news events.
In the realm of cryptocurrencies, both approaches have their merits. However, technical analysis is often favored for its ability to provide quick, actionable insights based solely on market data, without the need for extensive background knowledge on the crypto asset’s underlying fundamentals.
The Role of Price and Volume
The two pillars of technical analysis are price and volume. Price analysis involves examining historical price movements to predict future price behavior. This analysis can be as simple as identifying whether the price of a cryptocurrency is in an uptrend or downtrend based on its historical data.
Volume, on the other hand, signifies the number of coins or tokens traded over a given period. High volume often indicates a strong interest in the cryptocurrency at its current price, which can signify the strength or weakness of a trend. For instance, an uptrend accompanied by high trading volume can suggest a strong bullish sentiment, while an uptrend with low volume might indicate a weak market interest, potentially leading to a trend reversal.
Charting the Course

Technical analysis heavily relies on the use of charts. These charts represent the price movements and trading volumes of cryptocurrencies over various time frames. They serve as a visual aid for traders to spot trends, patterns, and potential reversal points. Common chart types include line charts, bar charts, and the more popular candlestick charts, each offering unique insights into market behavior.
Understanding Price Levels and Trends
Decoding Price Movements
In the realm of technical analysis, price levels and trends form the crux of market evaluation. Understanding these elements is essential for predicting future market behavior. Price levels are specific values at which a cryptocurrency consistently faces resistance (upper price level) or support (lower price level). These levels act as psychological barriers for traders, marking points where the price of a cryptocurrency tends to reverse its trend.
The Concept of Support and Resistance
Support is a price level where a downtrend can be expected to pause due to a concentration of demand. As the price of a cryptocurrency drops, demand for the asset increases, forming a support level. Conversely, resistance is the point where selling is thought to be strong enough to prevent the price from rising further. These levels are identified by analyzing historical data where the price has reversed in the past.
Trend Lines and Their Significance
Trends in cryptocurrency markets can be broadly categorized as upward (bullish), downward (bearish), or sideways (neutral). A trend line is a straight line that connects two or more price points and extends into the future to act as a line of support or resistance. Recognizing these trends helps traders in making decisions about entering or exiting trades. For example, a bullish trend might encourage a trader to buy, while a bearish trend might signal an opportunity to sell.
Using Trends for Prediction
The key to using trends effectively in technical analysis lies in the identification of their longevity and strength. Trends are generally classified as long-term, medium-term, or short-term. A long-term trend could persist for several months to years, a medium-term trend could last for a few weeks to a few months, and a short-term trend could occur over days to weeks. Understanding these can help traders time their entry and exit in the market more effectively.
The Significance of Trading Volume

Volume: The Trader’s Pulse
Trading volume is a crucial aspect of technical analysis, often considered the heartbeat of the market. It provides insights into the strength of a price move. High trading volumes typically indicate that a given price move is significant and likely to continue, while low volumes might suggest a lack of conviction among traders, potentially signaling a weak or temporary trend.
Volume and Price Correlation
The relationship between price and volume can reveal important market dynamics. For example, an upward price trend accompanied by increasing volume can be seen as a validation of the trend. Conversely, if the price is rising but the volume is decreasing, it might indicate a lack of interest, suggesting that the uptrend may be running out of steam.
Analyzing Volume Spikes
Sudden spikes in trading volume can be indicative of significant market events. These spikes often precede major price movements, serving as an early warning system for traders. For instance, a sudden increase in volume might precede a major news announcement or the release of economic data, which could significantly impact the price of a cryptocurrency.
Chart Patterns and Market Indicators
Recognizing Chart Patterns
Chart patterns play a pivotal role in technical analysis, offering visual cues about market sentiment and potential price movements. These patterns can be broadly classified into two categories: continuation patterns, which signal that an ongoing trend is likely to continue, and reversal patterns, indicating a possible change in the current trend.
- Continuation Patterns: Examples include triangles, flags, and pennants. These patterns suggest that, after a brief consolidation, the prevailing trend will resume.
- Reversal Patterns: Head and shoulders, double tops, and double bottoms are common reversal patterns. They signal that the current trend might be nearing its end, and a reversal could be imminent.
Utilizing Technical Indicators
Technical indicators are mathematical calculations based on a cryptocurrency’s price, volume, or open interest. They help in providing additional perspective and context to market analysis. Some widely-used indicators include:
- Moving Averages: These indicators smooth out price data to create a single flowing line, making it easier to identify the direction of the trend. The most common types are the Simple Moving Average (SMA) and the Exponential Moving Average (EMA).
- Relative Strength Index (RSI): RSI is a momentum indicator that measures the speed and change of price movements. It can indicate whether a cryptocurrency is overbought or oversold, providing insights into potential reversal points.
- Bollinger Bands: This indicator consists of a middle band being an SMA, and two outer bands that measure market volatility. Narrow bands suggest low volatility, while wide bands indicate high volatility.
The Importance of Combining Tools

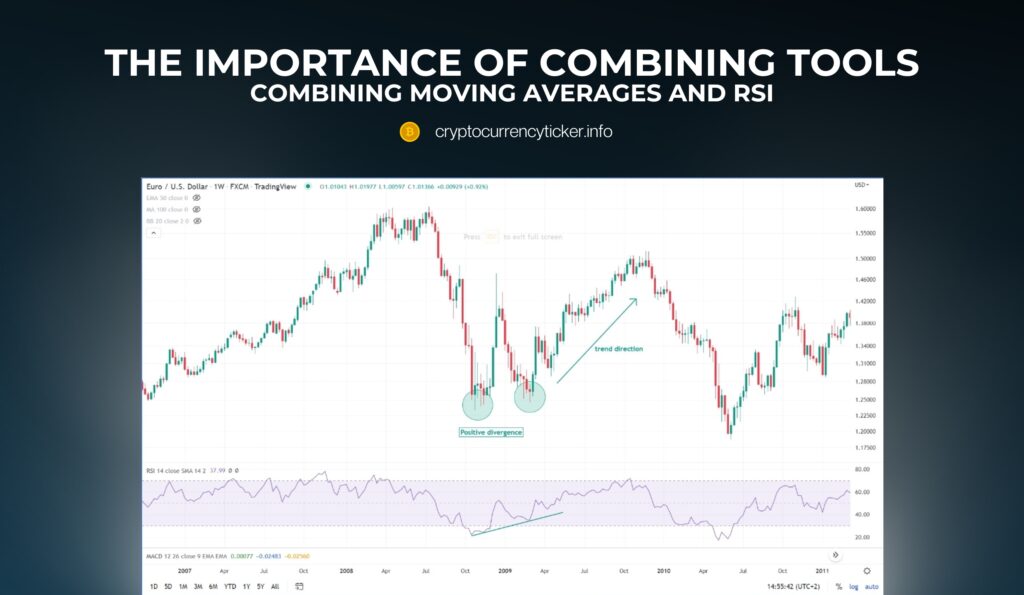
While each chart pattern and technical indicator offers valuable insights, they are most effective when used in conjunction. For instance, a trader might use a combination of moving averages and RSI to confirm the strength of a trend and potential reversal points. This multi-faceted approach helps in validating trading signals and making more informed decisions.
Developing Trading Strategies with Technical Analysis
Crafting a Personalized Approach
Developing a trading strategy using technical analysis involves more than just understanding charts and indicators. It requires the creation of a personalized approach that aligns with your trading style, risk tolerance, and investment goals.
Key Components of a Strategy
A comprehensive trading strategy should include:
- Entry and Exit Points: Decide when to enter and exit a trade based on specific technical criteria, such as a particular chart pattern or indicator reading.
- Risk Management: Establish clear rules for risk management, including setting stop-loss orders to minimize potential losses.
- Consistency and Discipline: Maintain consistency in applying your strategy and discipline in adhering to your predefined rules, especially during volatile market conditions.
Backtesting and Adaptation
Backtesting involves applying your trading strategy to historical market data to see how it would have performed. This process can help identify the strengths and weaknesses of your strategy. Remember, markets evolve, and strategies may need to be adapted to changing market conditions.
Tools and Resources for Beginners
Essential Tools for Technical Analysis

For beginners venturing into technical analysis in crypto trading, having the right tools is crucial. These tools range from charting platforms to market analysis software. Some popular and user-friendly options include:
- TradingView: Known for its comprehensive charting tools and social networking features, allowing traders to share and discuss their analyses.
- Coinigy: Offers a range of tools for trading and portfolio management across multiple cryptocurrency exchanges.
- CryptoCompare: Provides a wealth of market data, including price charts, volume, and historical data for various cryptocurrencies.
Online Resources and Learning Platforms
Besides tools, several online resources can aid in your learning journey. Websites like Investopedia, CoinMarketCap, and the subreddit r/CryptoCurrency offer educational articles, glossaries, and community discussions that are invaluable for beginners. Additionally, many cryptocurrency exchanges offer educational sections, tutorials, and webinars.
Importance of Continuous Learning
The field of technical analysis is vast and constantly evolving. Hence, continuous learning is key. Following market experts on social media, participating in forums, and attending webinars or workshops can keep you updated with the latest trends and techniques in crypto technical analysis.
Risks and Limitations of Technical Analysis
Understanding the Risks
While technical analysis can be a powerful tool, it’s important to be aware of its limitations and risks. One of the primary risks is the reliance on historical data, which may not always accurately predict future market movements. Market conditions can change rapidly, especially in the volatile crypto market, rendering past patterns and trends less relevant.
The Fallibility of Indicators
No technical indicator is foolproof. Each has its shortcomings and may provide false signals. For instance, the RSI may remain in overbought or oversold territory for extended periods during strong trends, leading to misleading signals. Therefore, it’s crucial to use multiple indicators and analysis techniques to validate trading signals.
The Importance of a Balanced Approach
A balanced approach that combines technical analysis with fundamental analysis and market sentiment can lead to more informed trading decisions. It’s also important to consider macroeconomic factors and global events that can influence the cryptocurrency market.
Conclusion
In wrapping up this guide, we emphasize the blend of art and science in technical analysis for cryptocurrency trading. Beginners should start by grasping the basics of price movements, trend analysis, chart patterns, and technical indicators. Utilizing the right tools and resources, such as TradingView and educational platforms, is crucial for enhancing learning.
Consistent practice, staying informed about market trends, and effective risk management are key to success in technical analysis. While it’s a powerful tool, remember it’s just one part of a broader trading strategy. Combining it with fundamental analysis and market news offers a more comprehensive approach.
Continuous learning and adapting to the evolving crypto market are essential. Engage with online communities and experts to stay updated. Ultimately, technical analysis is a journey of learning and adaptation, requiring dedication and a balanced approach to decision-making.
